Where to Find Scheduler Performance Data
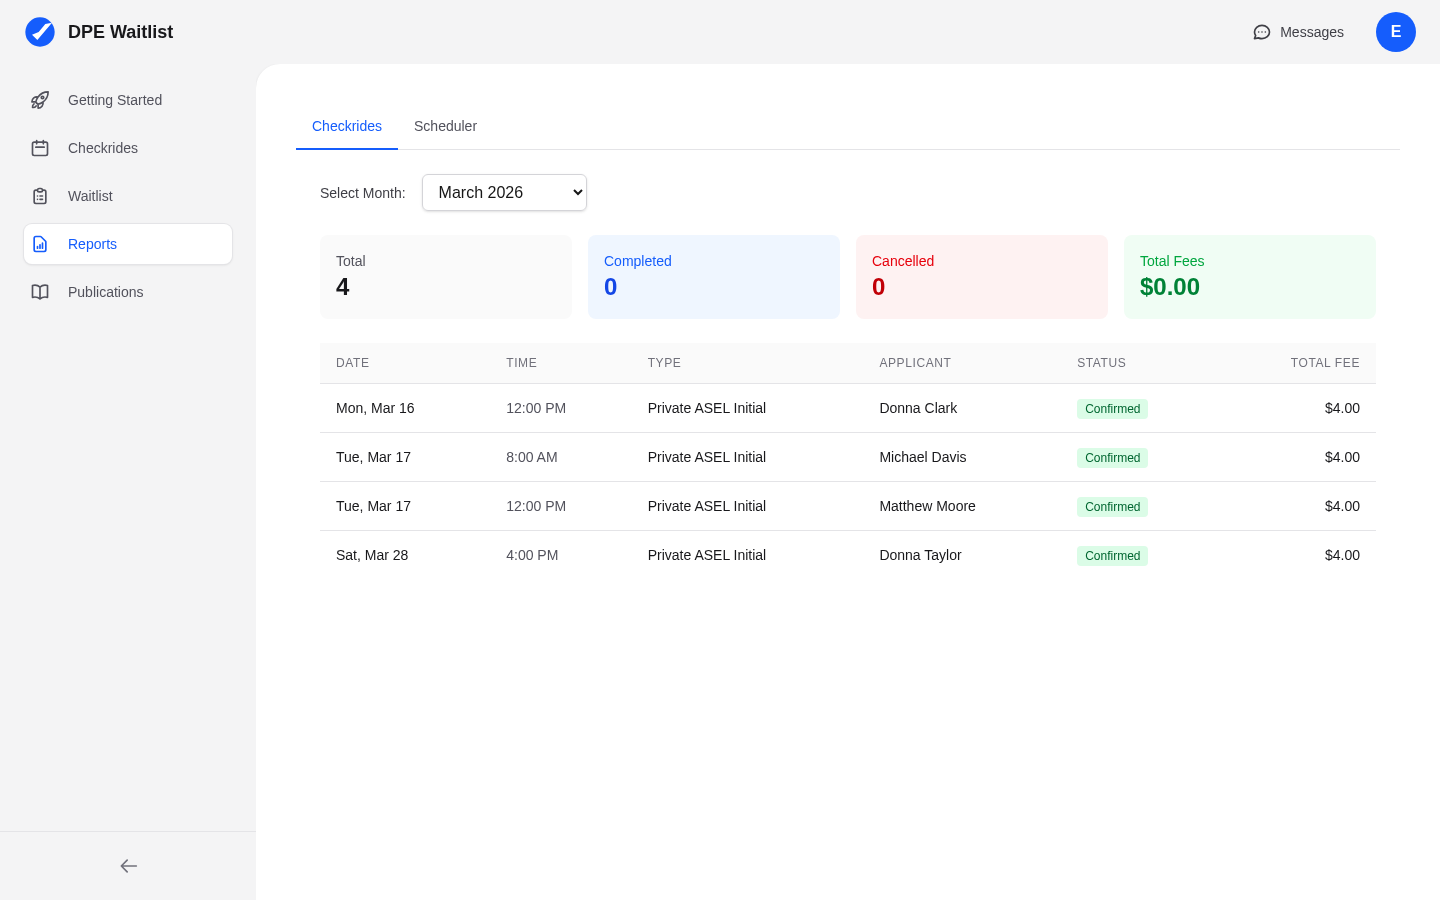
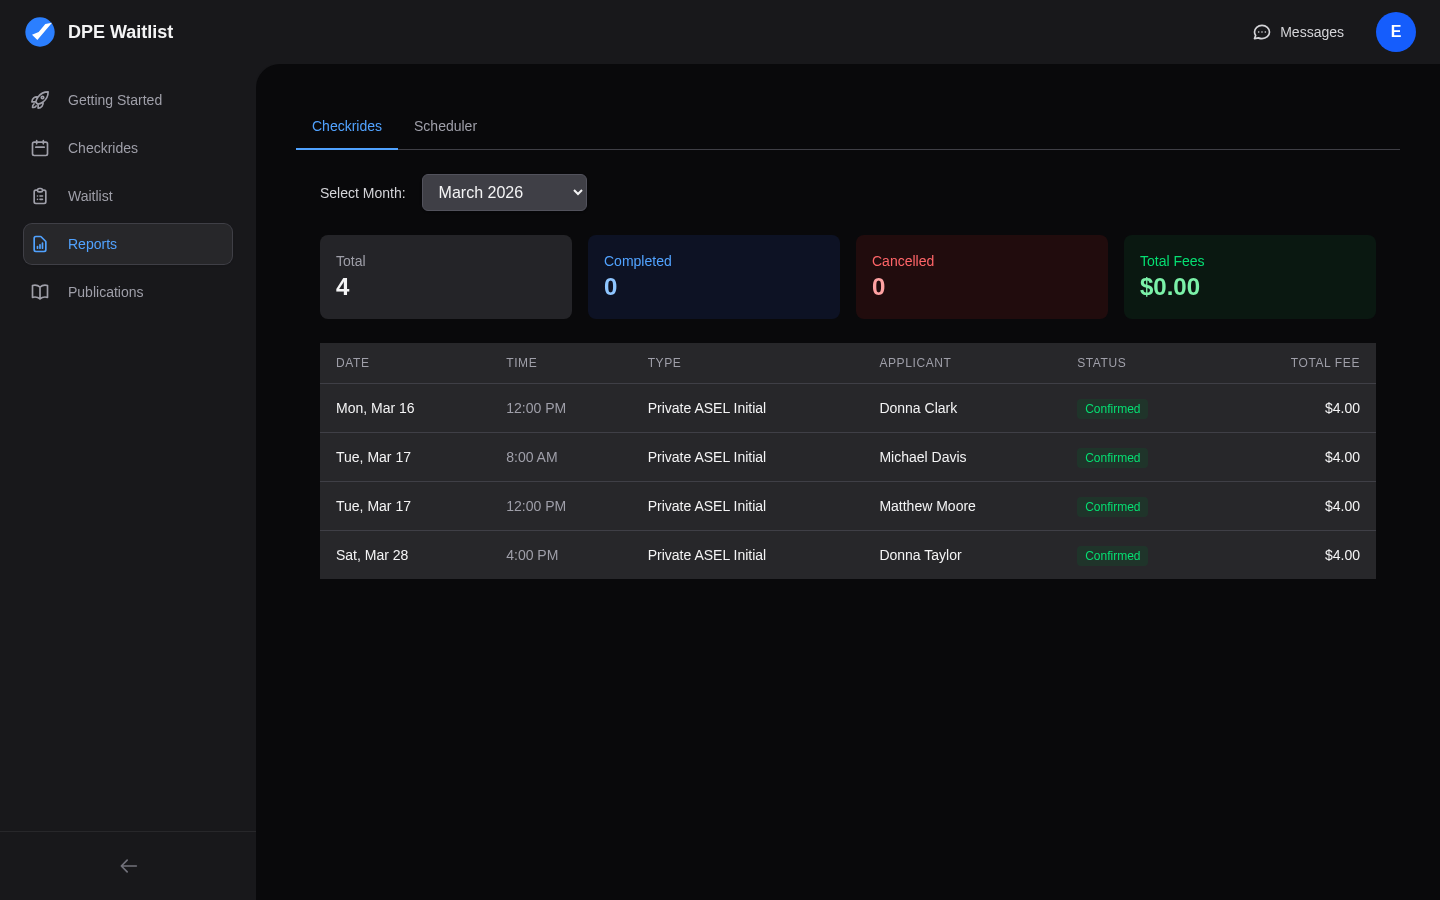
Scheduler performance metrics are available in the Reports section, accessible from the sidebar. Look for the scheduler-specific reports that show how effectively the automatic scheduler is filling your calendar.
Key Metrics to Watch
Fill Rate
The fill rate is the most important metric for scheduler effectiveness. It represents the percentage of available time slots that result in confirmed checkrides. A high fill rate means the scheduler is successfully matching applicants to your open slots. A low fill rate means many slots are going unfilled.
Offer Acceptance Rate
This metric shows the percentage of offers that applicants accept versus decline or let expire. A high acceptance rate means the scheduler is generating offers that match applicant preferences. A low acceptance rate suggests a mismatch between what you are offering and what applicants want.
Average Response Time
This measures how quickly applicants respond to checkride offers. Faster response times mean applicants are engaged and interested in the slots being offered. Slow response times may indicate that applicants are uncertain about the proposed dates or that notifications are not reaching them promptly.
Slot Utilization
Slot utilization compares the hours you make available to the hours that are actually filled with checkrides. This gives you a big-picture view of how much of your working time is being productively used.
What Good Metrics Look Like
- Fill rate above 70% — Most of your available slots are being filled.
- Acceptance rate above 60% — More than half of the offers you send are accepted.
- Response time under 24 hours — Applicants are responding to offers within a day.
What Concerning Metrics Look Like
- Fill rate below 40% — Too many slots are going unfilled. You may need more applicants on your waitlist or different availability times.
- Acceptance rate below 30% — Applicants are frequently declining offers. The times, locations, or advance notice may not match their needs.
- Response time over 48 hours — Applicants may not be seeing notifications. Encourage them to check their email and platform messages regularly.
Adjusting Settings Based on Performance
If your metrics indicate room for improvement, consider these adjustments:
- Low acceptance rate — Try adjusting your min/max days in advance settings. Applicants may be declining because offers are too soon or too far out. Also review whether your available times match when applicants prefer to fly.
- Low fill rate — You may need more applicants on your waitlist. Consider enabling self-serve waitlist signup or inviting more applicants.
- Many exhausted slots — Your waitlist may not have enough applicants for the slots you are offering. Consider reducing your availability to match demand or recruiting more applicants.